Bitcoin (BTC/USD) Market Consolidates at $57,000

Bitcoin Price Prediction – October 14
The BTC/USD market consolidates at the trading level of $57,000 after the crypto trade pushed above a key resistance point at $55,000. As of writing, the price trades around the line of $57,079 at a relatively negative percentage rate of about 0.89.
BTC/USD Market
Key Levels:
Resistance levels: $60,000, $62,500, $65,000
Support levels: $55,000, $52,500, $50,000
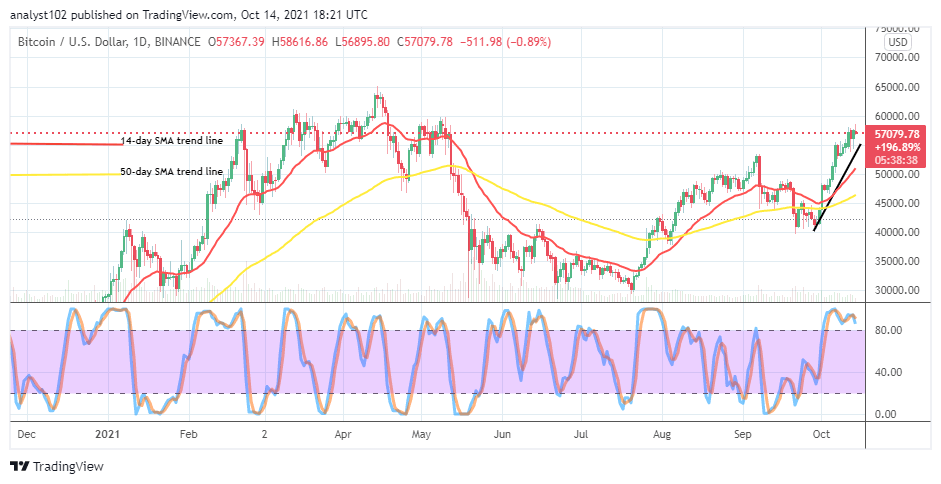
BTC/USD – Daily Chart
The BTC/USD daily chart reveals that the crypto market consolidates at $57,000, coupled with some efforts made to average higher lines close beneath the resistance level at $60,000. The 50-day SMA trend line is beneath the 14-day SMA trend line as the bullish drew across the SMAs to the north side. The Stochastic Oscillators are in the overbought region consolidating in it.
Will the BTC/USD trade operation continues to hold at a higher point as the market consolidates at $57,000?
There is the possibility that the BTC/USD trade operation, continue to hold at a higher point as the market consolidates at $57,000. The support level at $55,000 is the main crucial point that the market would have to continually build up to find energies to upkeep its bullish trend. However, a sudden emergence of a bearish candlestick engulfing immediate bullish candlesticks may lead the market to rebuild energy at lower trading support lines.
On the downside, the BTC/USD market bears must be cautious of their re-positioning at this time as there have been no active depression signs that have shown up. Even at higher trading zones presently. It is most likely that a decent sell entry will observe while the market tests a higher line around the $60,000 resistance level. Meanwhile, it may take a while.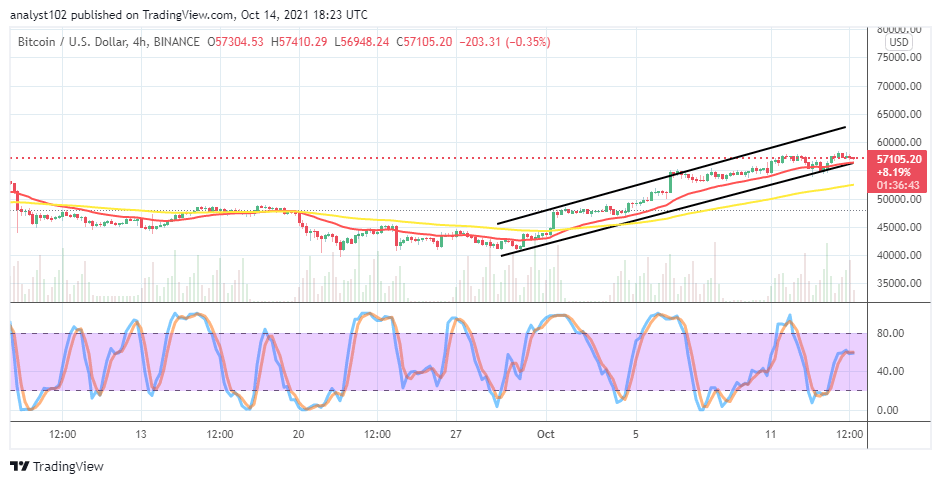
BTC/USD 4-hour Chart
The BTC/USD 4-hour chart showcases that the crypto market oscillates between $55,000 and $60,000 levels. The lower bullish channel trend line drew alongside the smaller SMA trend line. The 50-day SMA indicator is under the 14-day SMA indicator. The Stochastic Oscillators have conjoined the lines to point to the east, suggesting that the market may soon witness a short-line of range-bound trading situations.
Looking to buy or trade Bitcoin (BTC) now? Invest at eToro!
67% of retail investor accounts lose money when trading CFDs with this provider.
Read more:
- How to buy Bitcoin
- How to buy cryptocurrency