Stellar Price Prediction for 5th of October: XLM/USD Fails to Break the $0.118648 Price Level
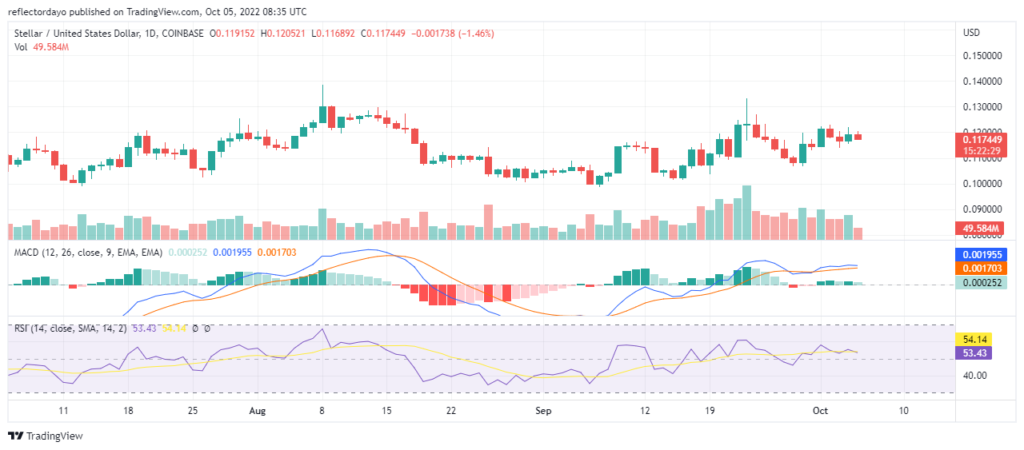

The Stellar is finding the $0.12000 resistance level a hard nut to crack as it has made several attempts to break away from the resistance level but keeps facing price rejection. Traders consider the price levels (above $0.120000) as the peak of the market and as a result, they keep selling from that height. On the 23rd of September, there was an increased interest among traders to buy and sell. The two market players matched their strength in the push and pull on the price on that day, but the price remains pegged near the opening price.
Stellar Market Price Statistic:
- XLM/USD price now: $0.1176
- XLM/USD market cap: $2,995656862
- XLM/USD circulating supply: 25.48 Billion
- XLM/USD total supply: 50,001,787,50
- XLM /USD coin market ranking: #25
Key Levels
- Resistance: $0.12000000, $0.13000000, $0.1350000
- Support: $0.1000000, $0.1050000, $0.099552
Buy Stellar Now
Your capital is at risk
Stellar Market Price Analysis: The Indicators’ Point of View
The market’s trading volume reached its peak on the 23rd of September. There was an increase of interest to buy and sell among traders. The result of this was a very volatile market for the day. Since the 23rd of September, the trading volume and the volatility of the market reduces. And the market went the bearish way consecutively for five days before it takes support from $0.108290. The market has now found another higher support level at $0.116716. And this is closer to the resistance level of $0.120000. There is an imminent price breakout from this level.
The MACD signals are decrease in bullish momentum this is a result of today’s bullish candle
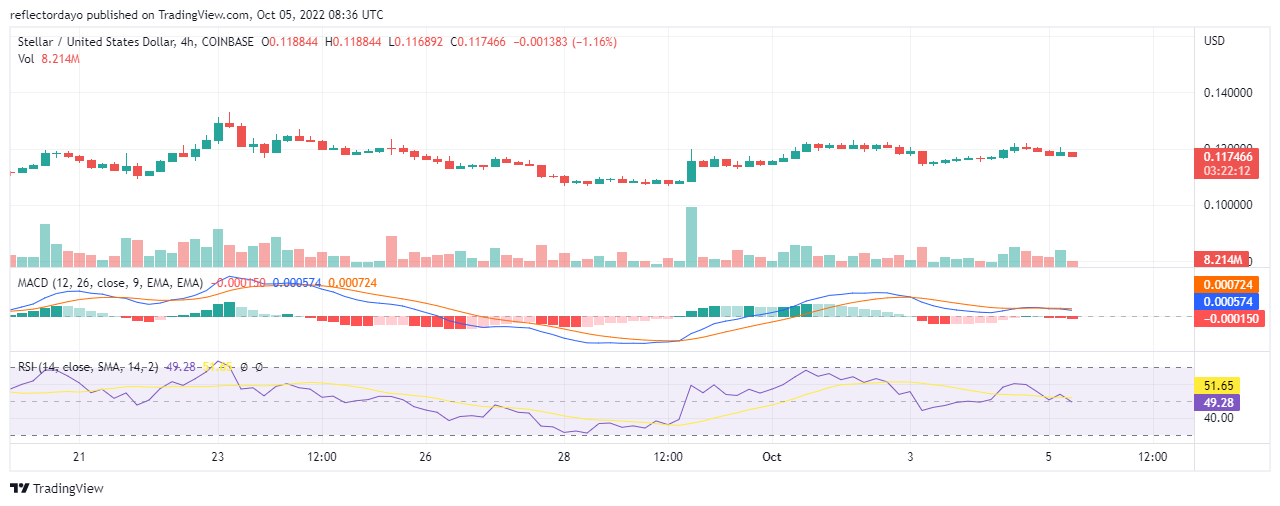
XLM/USD 4-Hour Chart Outlook
The indicators in this timeframe are showing lines that have crossed the threshold that seperate the bulls market from the bears market. The MACD histograms are now indicating an increasing bearish pressure. It looks like the bulls are now losing ground to the bears. If this trend continues, it will soon reflect in the daily timeframe market chart. The bullish trend may eventually reverse.
Tamadoge – Play to Earn Meme Coin

- Earn TAMA in Battles With Doge Pets
- Maximum Supply of 2 Bn, Token Burn
- Now Listed on OKX, Bitmart, Uniswap
- Upcoming Listings on LBank, MEXC